Is there any feature or plug-in can use it in Visual Paradigm modelling to measure complexity , cohesion , and coupling of Class Diagram .
First off a small disclaimer: I’m currently commenting on features which I’m not directly familiar with myself. I know what they do, but I don’t have personal experience because these are supported by a higher tier license than the one I have.
I don’t know if any plugins are available (never kept up to speed with those) but I think the Impact Analysis tools are what you’re looking for. Although not fully automated (they won’t ‘rate’ one diagram over another) it will give you a good insight overview of a diagrams complexity, the Matrix tool in particular.
Impact Analysis is supported by the Standard version and up.
I hope this can help here.
I think there is no tool can support it. Because I have found so long, I cannot see anything is useful for my discovery.
Have to disagree, it should be possible. Maybe not fully but it can come close. Note that I’m basing my comments partly on the Wikipedia page about cohesion as well as this page (Java short course) which is also an interesting read.
A very simplistic example: coupling could be partly measured by the amount of used connectors. Something perfectly doable within a plugin. The problem though is to apply a scaling to it. Cohesion can be analyzed by checking the class properties and comparing those. That’s also well within the possibilities of a plugin.
The main problem is working out the full definition and then applying that, which is the tricky part.
Definitely there should be a done work or an ongoing work ! it is a possible cos I found a one that measure quality metrics on business process model for all aspects ( complexity , coupling and cohesion) but the issue here I couldn’t find any one for UML model . Most available tools measured metrics at code level not model. And my supervisor told me to measure it manually which is hard in cohesion aspect for a complex UML model ! And I’m sure there is one found but no much of sources
It’s good for you to comment here again because I had totally forgotten about this thread.
In the mean time I gained access to the Professional edition of Visual Paradigm (previously Modeler) which automatically gives me access to a lot more functionality. And this did intrigue me because I wasn’t fully familiar with the concept of cohesion and coupling.
From what I can tell VP doesn’t provide an option which can “rate” a diagram (this is how I’d describe measuring coupling). However, you can create matrix diagrams through impact analysis which can give you a good overview of the diagram you’re working with.
For starters…
There are a lot of different definitions out there but this generally seems to apply:
- Coupling: relates to relationships between modules.
- Cohesion: relates to relationships within a module.
Relationships between classes is a type of association / generalization. Which could be measured (or studied) by checking for the amount of relationships.
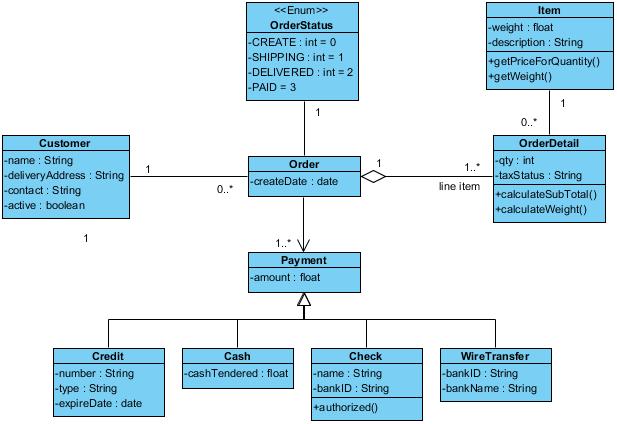
For example, I downloaded this class diagram from the Community Circle:
Then I right click, select ‘Utilities’ and then select “Create Matrix diagram”. Add the class to both row and column, set ‘Match by’ to relationship and then click ok. You’ll end up with something like this:
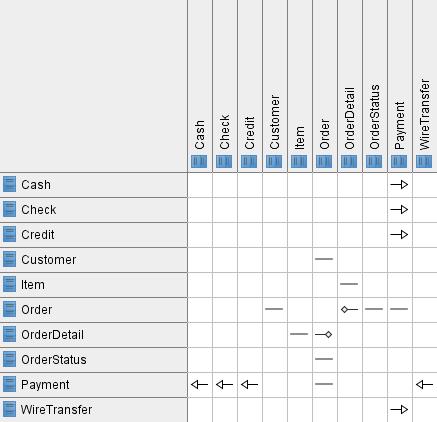
Although this doesn’t really “measure” coupling it does give you a good overview of the relationships between the classes, and also how much (or little) certain classes interact with each other.
As said this isn’t directly comparable to the functionality you’re looking for, but I think it does provide an impression of the diagrams complexity.
1 Like
That’s so inspiring thank you, I have tried both techniques for change impact in VP ( Matrix Diagram and Analysis Diagram) both are useful in just visualisation of related elements. Also I found it useful in visualizing related elements among two models ( if you define a transformation from one model to another ). In my case I need to get values of set of quality metrics to compare it with value of thresholds so I can decide if the model is a good quality design or not.