Hi
I’m using version 7.1 and sometimes the application hangs and I have to kill it and relaunch it on Mac OS X.
I didn’t have this problem on the 7.0 version with evaluation licence.
I noticed I have a java process using 100% of my CPU 
Thanks
Hi
I’m using version 7.1 and sometimes the application hangs and I have to kill it and relaunch it on Mac OS X.
I didn’t have this problem on the 7.0 version with evaluation licence.
I noticed I have a java process using 100% of my CPU
Thanks
Hi Yeti,
Thanks for your post and we are sorry about this problem. May I know usually what operation it was doing while it hanged?
Also, could you please send me the vp.log file inside VPSuite/bin folder to take a look? Thanks in advance!
Best regards,
Lilian Wong
Hi, I don’t do anything special, it just appends randomely.
Here is the end on the log file I extracted (Help-About-etc), it seems I don’t have write permissions but I don’t seen any reason for VP need to write in there.
VP is set up in a multi-user Mac, we installed it in Applications, so a basic user doesn’t have any permission on it.
[Fri Oct 09 15:34:31 CEST 2009] [message] [Fri Oct 09 15:34:31 CEST 2009]: Start Visual Paradigm for UML Enterprise Edition [VP-UML EE]: 7.1 (20090918)
[Fri Oct 09 15:34:37 CEST 2009] [message] Exception in thread "AWT-EventQueue-0"
[Fri Oct 09 15:34:37 CEST 2009] [message] java.lang.ArrayIndexOutOfBoundsException: No such child: 2
[Fri Oct 09 15:34:37 CEST 2009] [message] at java.awt.Container.getComponent(Container.java:294)
[Fri Oct 09 15:34:37 CEST 2009] [message] at com.jidesoft.swing.JideSplitPane.setDividersVisible(Unknown Source)
[Fri Oct 09 15:34:37 CEST 2009] [message] at com.jidesoft.swing.JideSplitPane.componentHidden(Unknown Source)
[Fri Oct 09 15:34:37 CEST 2009] [message] at java.awt.Component.processComponentEvent(Component.java:6183)
[Fri Oct 09 15:34:37 CEST 2009] [message] at java.awt.Component.processEvent(Component.java:6128)
[Fri Oct 09 15:34:37 CEST 2009] [message] at java.awt.Container.processEvent(Container.java:2085)
[Fri Oct 09 15:34:37 CEST 2009] [message] at java.awt.Component.dispatchEventImpl(Component.java:4714)
[Fri Oct 09 15:34:37 CEST 2009] [message] at java.awt.Container.dispatchEventImpl(Container.java:2143)
[Fri Oct 09 15:34:37 CEST 2009] [message] at java.awt.Component.dispatchEvent(Component.java:4544)
[Fri Oct 09 15:34:37 CEST 2009] [message] at java.awt.EventQueue.dispatchEvent(EventQueue.java:635)
[Fri Oct 09 15:34:37 CEST 2009] [message] at java.awt.EventDispatchThread.pumpOneEventForFilters(EventDispatchThread.java:296)
[Fri Oct 09 15:34:37 CEST 2009] [message] at java.awt.EventDispatchThread.pumpEventsForFilter(EventDispatchThread.java:211)
[Fri Oct 09 15:34:37 CEST 2009] [message] at java.awt.EventDispatchThread.pumpEventsForHierarchy(EventDispatchThread.java:201)
[Fri Oct 09 15:34:37 CEST 2009] [message] at java.awt.EventDispatchThread.pumpEvents(EventDispatchThread.java:196)
[Fri Oct 09 15:34:37 CEST 2009] [message] at java.awt.EventDispatchThread.pumpEvents(EventDispatchThread.java:188)
[Fri Oct 09 15:34:37 CEST 2009] [message] at java.awt.EventDispatchThread.run(EventDispatchThread.java:122)
[Fri Oct 09 15:34:39 CEST 2009] [warning] No write permission on Suite "/Applications/VP Suite 4.1/bin"
Hi Yeti,
Thanks for your replying. May I know you are using Java 1.6? If yes, could you please dump the thread by JVisualVM when VP-UML hangs, so our engineers can check the problem? Thanks in advance!
FYI, JVisualVM (jvisualvm.exe) is available in ${Java1.6}/bin folder. You can select the process ID of VP-UML for dumping the thread and sending the thread to us (in .txt file).
Thanks in advance!
Best regards,
Lilian Wong
Hi,
Yes, java -version gives
java version "1.6.0_15"
Java(TM) SE Runtime Environment (build 1.6.0_15-b03-219)
Java HotSpot(TM) 64-Bit Server VM (build 14.1-b02-90, mixed mode)
When I do
Kill -3 PID of the java VM
, nothing is displayed on the screen, no file seems to be created.
I’m using Mac OS Snow Leopard.
Edit : jstack returns
2009-10-12 09:52:33
Full thread dump Java HotSpot(TM) 64-Bit Server VM (14.1-b02-90 mixed mode):

"Attach Listener" daemon prio=9 tid=0x00000001093ee800 nid=0x14a347000 waiting on condition [0x0000000000000000]
   java.lang.Thread.State: RUNNABLE

"AWT-EventQueue-0" prio=6 tid=0x0000000108989800 nid=0x148ac0000 waiting on condition [0x0000000148abe000]
   java.lang.Thread.State: RUNNABLE
	at java.awt.Menu.handleShortcut(Menu.java:433)
	at java.awt.Menu.handleShortcut(Menu.java:435)
	at java.awt.MenuBar.handleShortcut(MenuBar.java:352)
	at java.awt.Frame.postProcessKeyEvent(Frame.java:891)
	at java.awt.Container.postProcessKeyEvent(Container.java:3441)
	at java.awt.Container.postProcessKeyEvent(Container.java:3441)
	at java.awt.Container.postProcessKeyEvent(Container.java:3441)
	at java.awt.Container.postProcessKeyEvent(Container.java:3441)
	at java.awt.Container.postProcessKeyEvent(Container.java:3441)
	at java.awt.Container.postProcessKeyEvent(Container.java:3441)
	at java.awt.Container.postProcessKeyEvent(Container.java:3441)
	at java.awt.Container.postProcessKeyEvent(Container.java:3441)
	at java.awt.Container.postProcessKeyEvent(Container.java:3441)
	at java.awt.Container.postProcessKeyEvent(Container.java:3441)
	at java.awt.Container.postProcessKeyEvent(Container.java:3441)
	at java.awt.Container.postProcessKeyEvent(Container.java:3441)
	at java.awt.Container.postProcessKeyEvent(Container.java:3441)
	at java.awt.Container.postProcessKeyEvent(Container.java:3441)
	at java.awt.Container.postProcessKeyEvent(Container.java:3441)
	at java.awt.Container.postProcessKeyEvent(Container.java:3441)
	at java.awt.Container.postProcessKeyEvent(Container.java:3441)
	at java.awt.Container.postProcessKeyEvent(Container.java:3441)
	at java.awt.Container.postProcessKeyEvent(Container.java:3441)
	at java.awt.Container.postProcessKeyEvent(Container.java:3441)
	at java.awt.Container.postProcessKeyEvent(Container.java:3441)
	at java.awt.Container.postProcessKeyEvent(Container.java:3441)
	at java.awt.Container.postProcessKeyEvent(Container.java:3441)
	at java.awt.Container.postProcessKeyEvent(Container.java:3441)
	at java.awt.Container.postProcessKeyEvent(Container.java:3441)
	at java.awt.Container.postProcessKeyEvent(Container.java:3441)
	at java.awt.Container.postProcessKeyEvent(Container.java:3441)
	at java.awt.Container.postProcessKeyEvent(Container.java:3441)
	at java.awt.Container.postProcessKeyEvent(Container.java:3441)
	at java.awt.Container.postProcessKeyEvent(Container.java:3441)
	at java.awt.Container.postProcessKeyEvent(Container.java:3441)
	at java.awt.Container.postProcessKeyEvent(Container.java:3441)
	at java.awt.DefaultKeyboardFocusManager.postProcessKeyEvent(DefaultKeyboardFocusManager.java:758)
	at java.awt.DefaultKeyboardFocusManager.dispatchKeyEvent(DefaultKeyboardFocusManager.java:719)
	at java.awt.DefaultKeyboardFocusManager.preDispatchKeyEvent(DefaultKeyboardFocusManager.java:969)
	at java.awt.DefaultKeyboardFocusManager.typeAheadAssertions(DefaultKeyboardFocusManager.java:841)
	at java.awt.DefaultKeyboardFocusManager.dispatchEvent(DefaultKeyboardFocusManager.java:668)
	at java.awt.Component.dispatchEventImpl(Component.java:4586)
	at java.awt.Container.dispatchEventImpl(Container.java:2143)
	at java.awt.Window.dispatchEventImpl(Window.java:2475)
	at java.awt.Component.dispatchEvent(Component.java:4544)
	at java.awt.EventQueue.dispatchEvent(EventQueue.java:635)
	at java.awt.EventDispatchThread.pumpOneEventForFilters(EventDispatchThread.java:296)
	at java.awt.EventDispatchThread.pumpEventsForFilter(EventDispatchThread.java:211)
	at java.awt.EventDispatchThread.pumpEventsForHierarchy(EventDispatchThread.java:201)
	at java.awt.EventDispatchThread.pumpEvents(EventDispatchThread.java:196)
	at java.awt.EventDispatchThread.pumpEvents(EventDispatchThread.java:188)
	at java.awt.EventDispatchThread.run(EventDispatchThread.java:122)

"Thread-17" daemon prio=6 tid=0x0000000108ff7000 nid=0x165ce0000 in Object.wait() [0x0000000165cdf000]
   java.lang.Thread.State: WAITING (on object monitor)
	at java.lang.Object.wait(Native Method)
	- waiting on <0x00000001110b2c88> (a java.lang.ref.ReferenceQueue$Lock)
	at java.lang.ref.ReferenceQueue.remove(ReferenceQueue.java:118)
	- locked <0x00000001110b2c88> (a java.lang.ref.ReferenceQueue$Lock)
	at java.lang.ref.ReferenceQueue.remove(ReferenceQueue.java:134)
	at org.apache.batik.util.CleanerThread.run(Unknown Source)

"Java Sound Event Dispatcher" daemon prio=5 tid=0x000000010971c000 nid=0x14d307000 in Object.wait() [0x000000014d306000]
   java.lang.Thread.State: WAITING (on object monitor)
	at java.lang.Object.wait(Native Method)
	- waiting on <0x000000010f8d9498> (a com.sun.media.sound.EventDispatcher)
	at java.lang.Object.wait(Object.java:485)
	at com.sun.media.sound.EventDispatcher.dispatchEvents(EventDispatcher.java:170)
	- locked <0x000000010f8d9498> (a com.sun.media.sound.EventDispatcher)
	at com.sun.media.sound.EventDispatcher.run(EventDispatcher.java:210)
	at java.lang.Thread.run(Thread.java:637)

"TimerQueue" daemon prio=5 tid=0x0000000109194000 nid=0x149d96000 in Object.wait() [0x0000000149d95000]
   java.lang.Thread.State: TIMED_WAITING (on object monitor)
	at java.lang.Object.wait(Native Method)
	- waiting on <0x000000010f1a3448> (a javax.swing.TimerQueue)
	at javax.swing.TimerQueue.run(TimerQueue.java:236)
	- locked <0x000000010f1a3448> (a javax.swing.TimerQueue)
	at java.lang.Thread.run(Thread.java:637)

"DestroyJavaVM" prio=5 tid=0x0000000108801800 nid=0x103101000 waiting on condition [0x0000000000000000]
   java.lang.Thread.State: RUNNABLE

"Java2D Disposer" daemon prio=10 tid=0x00000001090a6000 nid=0x148948000 in Object.wait() [0x0000000148947000]
   java.lang.Thread.State: WAITING (on object monitor)
	at java.lang.Object.wait(Native Method)
	- waiting on <0x000000010f25f420> (a java.lang.ref.ReferenceQueue$Lock)
	at java.lang.ref.ReferenceQueue.remove(ReferenceQueue.java:118)
	- locked <0x000000010f25f420> (a java.lang.ref.ReferenceQueue$Lock)
	at java.lang.ref.ReferenceQueue.remove(ReferenceQueue.java:134)
	at sun.java2d.Disposer.run(Disposer.java:125)
	at java.lang.Thread.run(Thread.java:637)

"AWT-Shutdown" prio=5 tid=0x0000000109008800 nid=0x146b65000 in Object.wait() [0x0000000146b64000]
   java.lang.Thread.State: WAITING (on object monitor)
	at java.lang.Object.wait(Native Method)
	- waiting on <0x000000010f25f450> (a java.lang.Object)
	at java.lang.Object.wait(Object.java:485)
	at sun.awt.AWTAutoShutdown.run(AWTAutoShutdown.java:259)
	- locked <0x000000010f25f450> (a java.lang.Object)
	at java.lang.Thread.run(Thread.java:637)

"AWT-AppKit" daemon prio=5 tid=0x00000001090c1000 nid=0x100883be0 runnable [0x0000000000000000]
   java.lang.Thread.State: RUNNABLE

"Low Memory Detector" daemon prio=5 tid=0x00000001088a9800 nid=0x135c0d000 runnable [0x0000000000000000]
   java.lang.Thread.State: RUNNABLE

"CompilerThread1" daemon prio=9 tid=0x000000010900e000 nid=0x135b0a000 waiting on condition [0x0000000000000000]
   java.lang.Thread.State: RUNNABLE

"CompilerThread0" daemon prio=9 tid=0x000000010900d000 nid=0x135a07000 waiting on condition [0x0000000000000000]
   java.lang.Thread.State: RUNNABLE

"Signal Dispatcher" daemon prio=9 tid=0x000000010900c800 nid=0x135904000 runnable [0x0000000000000000]
   java.lang.Thread.State: RUNNABLE

"Surrogate Locker Thread (CMS)" daemon prio=5 tid=0x000000010900b800 nid=0x135801000 waiting on condition [0x0000000000000000]
   java.lang.Thread.State: RUNNABLE

"Finalizer" daemon prio=8 tid=0x000000010889b000 nid=0x1353e3000 in Object.wait() [0x00000001353e2000]
   java.lang.Thread.State: WAITING (on object monitor)
	at java.lang.Object.wait(Native Method)
	- waiting on <0x000000010f25f570> (a java.lang.ref.ReferenceQueue$Lock)
	at java.lang.ref.ReferenceQueue.remove(ReferenceQueue.java:118)
	- locked <0x000000010f25f570> (a java.lang.ref.ReferenceQueue$Lock)
	at java.lang.ref.ReferenceQueue.remove(ReferenceQueue.java:134)
	at java.lang.ref.Finalizer$FinalizerThread.run(Finalizer.java:159)

"Reference Handler" daemon prio=10 tid=0x000000010889a000 nid=0x1352e0000 in Object.wait() [0x00000001352df000]
   java.lang.Thread.State: WAITING (on object monitor)
	at java.lang.Object.wait(Native Method)
	- waiting on <0x000000010f1a0018> (a java.lang.ref.Reference$Lock)
	at java.lang.Object.wait(Object.java:485)
	at java.lang.ref.Reference$ReferenceHandler.run(Reference.java:116)
	- locked <0x000000010f1a0018> (a java.lang.ref.Reference$Lock)

"VM Thread" prio=9 tid=0x0000000108897000 nid=0x1351dd000 runnable

"Gang worker#0 (Parallel GC Threads)" prio=9 tid=0x0000000108803000 nid=0x107cb4000 runnable

"Gang worker#1 (Parallel GC Threads)" prio=9 tid=0x0000000108803800 nid=0x107db7000 runnable

"Concurrent Mark-Sweep GC Thread" prio=9 tid=0x0000000108842800 nid=0x134ea7000 runnable
"VM Periodic Task Thread" prio=10 tid=0x00000001088aa800 nid=0x135d10000 waiting on condition

"Exception Catcher Thread" prio=10 tid=0x0000000108802800 nid=0x107add000 runnable
JNI global references: 15844
In this case, I had just asked to save the diagram using a shortcut (which explains the postProcessKeyEvent call).
Hangs don’t only happen on key events.
Hi Yeti,
Thanks for replying and the details. Our engineers checked the code and it’s running Java code instead of our code, and it seems not hanged.
But you mentioned the Java process consumed 100% of your CPU, this should be a dead loop. Could you please wait the application to hang and dump the thread by JVisualVM, wait for few seconds later and dump the thread again. Then repeat thread dumping few times, and save them in .txt for our engineers to check what is looping? Thanks in advance!
And may I know what step you had when it hanged before?
BTW, detailed steps for dumping thread of VP-UML:
Best regards,
Lilian Wong
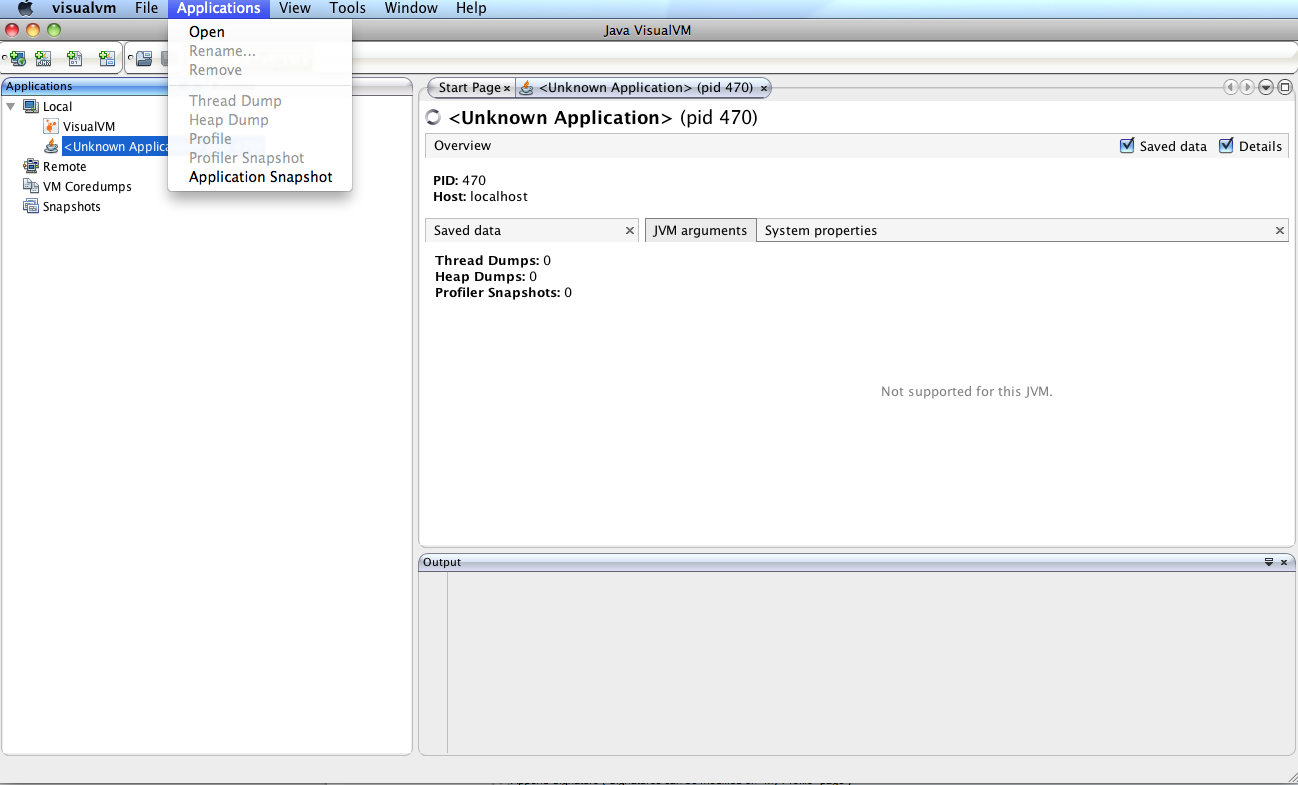
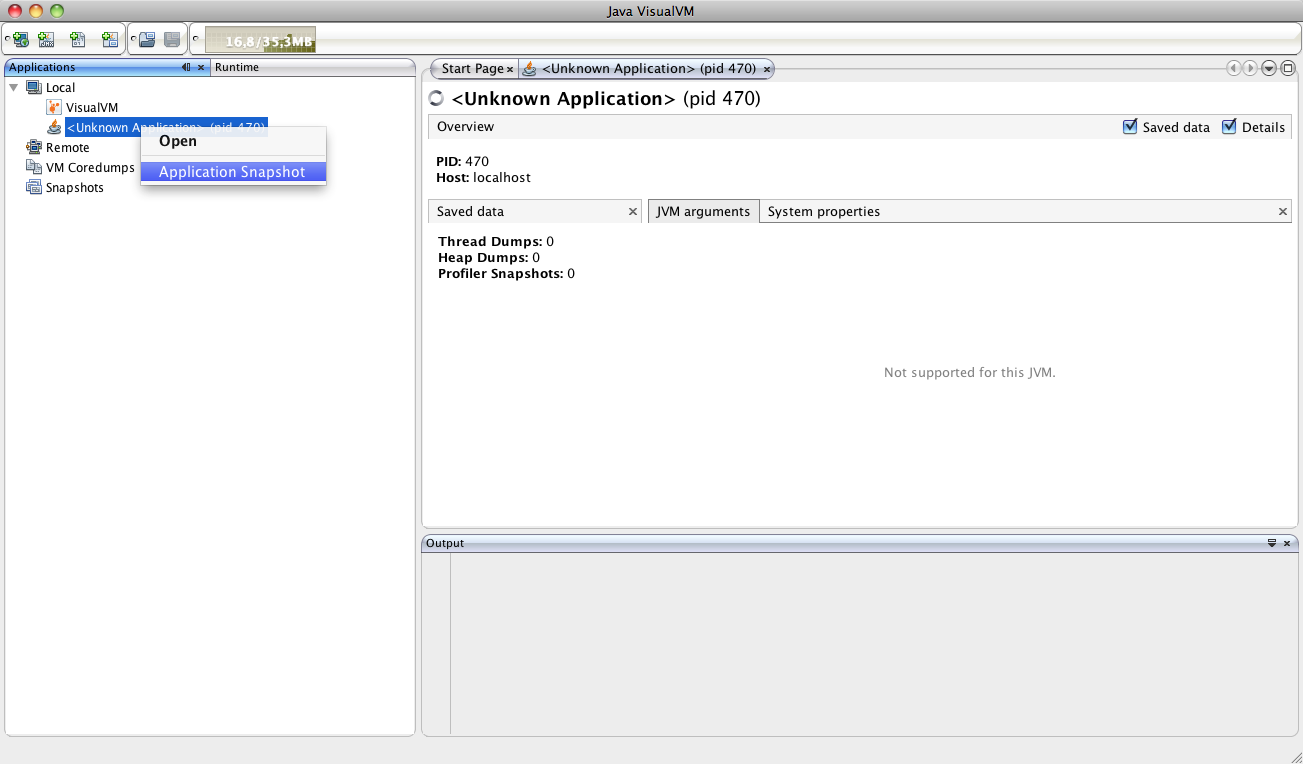
Hi, when I right click on the process, I don’t have any “Thead dump” option, I just can do an application snapshot.
Edit, when I select the right process, the “thread dump” option isn’t enabled in the application menu.
VP UML is shown as “unknown application”
Hi Yeti,
Thanks for replying. Would you mind to capture a screenshot of
Also, would you mind to tell me what version of Mac OS X you are using, and do you use other language in VP-UML? Thanks!
Best regards,
Lilian Wong 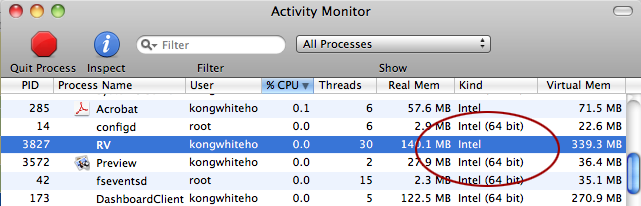
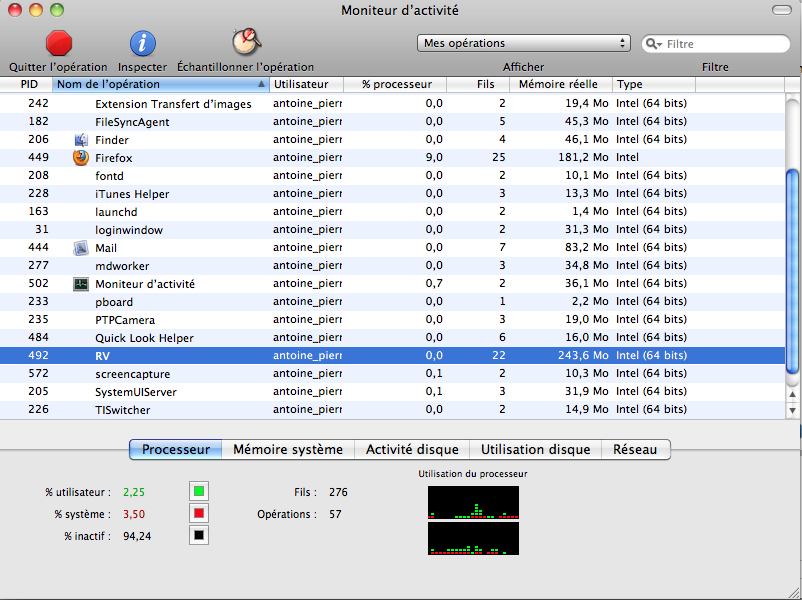
activity_monitor.png
You will find attached the activity monitor.
Nothing happens when I right click on the process.
I’m using the 10.6.1 Snow Leopard Mac OS version.
So far I just use UML.
Thanks.
Hi Yeti,
Thanks for replying. I’m sorry that I do not make my request clearly. Could you please right-click on the VP-UML process in JVisualVM so I can see what popup menus do you have (you said tehre is Thread Dump menu there)? Thanks in advance!
Best regards,
Lilian Wong
Hi,
Here are some screenshots :
As you can see, the Thread Dump option is disabled…
Hi Yeti,
Thanks for replying with the screenshot. The problem should relate to 64-bit, could you please run “VP Suite Update” to update to latest build of VP-UML (20091017) and see if the problem can be solved?
I look forward to hearing your response.
Best regards,
Lilian Wong
Hi there.
I just updated to 20091021g version, I will let you know what’s going on!
Hi Yeti,
Thanks and I look forward to hearing from you again.
Best regards,
Lilian Wong