I am testing the User Story Map features of VP and I think I am following the process correctly but when I come to the Burndown Chart for a Sprint the Story point shows as zero (using VP 16.3). Here is the process I followed:
Make a Simplified 2 (3-level) User Story Map.
Make some user stories, put them in Release 1, assign a user and add to the development backlog.
Click Estimate and Spike and put the user stories on the affinity table.
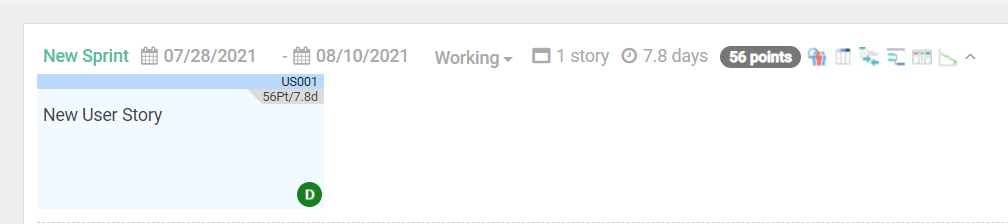
Click the Sprint tab and make a new sprint and add user stories to the sprint.
Change the Sprint to Working.
Click on the Burndown Chart.
At this point both the Estimated burndown and the Actual burndown show as zero. I expected it to show the points for the sprint as the estimated burndown starting value.
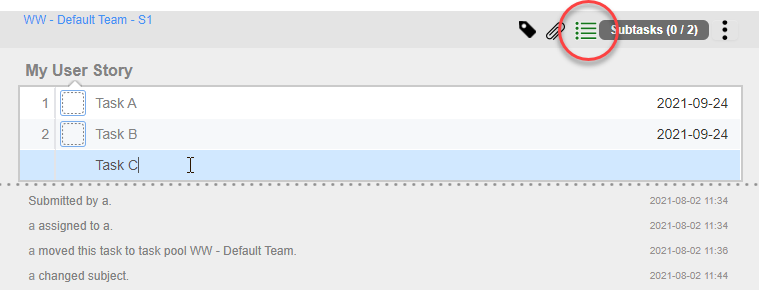
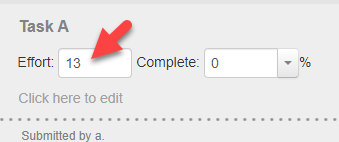
Other things I have tried are to synchronize it with Tasifier and change things in Tasifier. In Tasifier the user stories look like they are tasks but when I click on them there is an effort box with nothing in it. If I add subtasks and give them a value for the effort I think it changes that Actual burndown on the chart but the estimated burndown is still zero. I have not been able to get the estimated burndown to be anything other than zero.
I have not tried using the full Scrum Canvas and working through the examples for that.
Any advice on what I am doing wrong? Is it possible to just use the User Story Map like I am trying?
David
Thank you for your post. The two problems you reported are both forwarded to our engineering team for further checking. I will let you know when there is any update.
Jick,
I tried this and it works. I think the main thing is that when you change the Sprint from Planning to Working the burndown chart is created. So, if you have have no tasks then the effort is 0. You have to create tasks in Tasifier and put the effort for each task then change from Planning to Working.
Also, I thought that if I changed the effort for a task then the estimated burndown would update to a new value. But it does not. The Actual burndown changes but the Estimated burndown does not. It stays at the level that was there when the Sprint changed from Planning to Working.
The connection from Tasifier to the Sprints on the Sprint page is not clear. I tried changing the percent complete on one of the tasks but the Actual burndown on the Sprint Burndown chart did not change. How do I update the completeness of the tasks so that it shows on the burndown chart?