Hello together,
I’m playing around with the “Data Table” diagram. The basics are clear, but with things like “Use Multiple Header Rows”, Calculations in rows or “Element(s) as Column(s)” I have no idea what I have to do there.
Is there any documentation for this diagram type?
Greetings,
Georg
Data Table is designed for inputing data in tabular form.
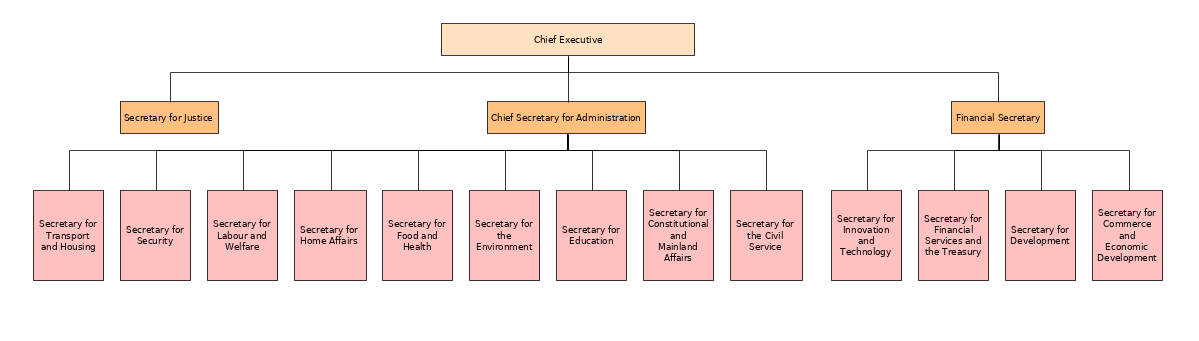
For example, based on a Org. Chart of the government of Hong Kong, we use Data Table to input some extra information.
Basic concept
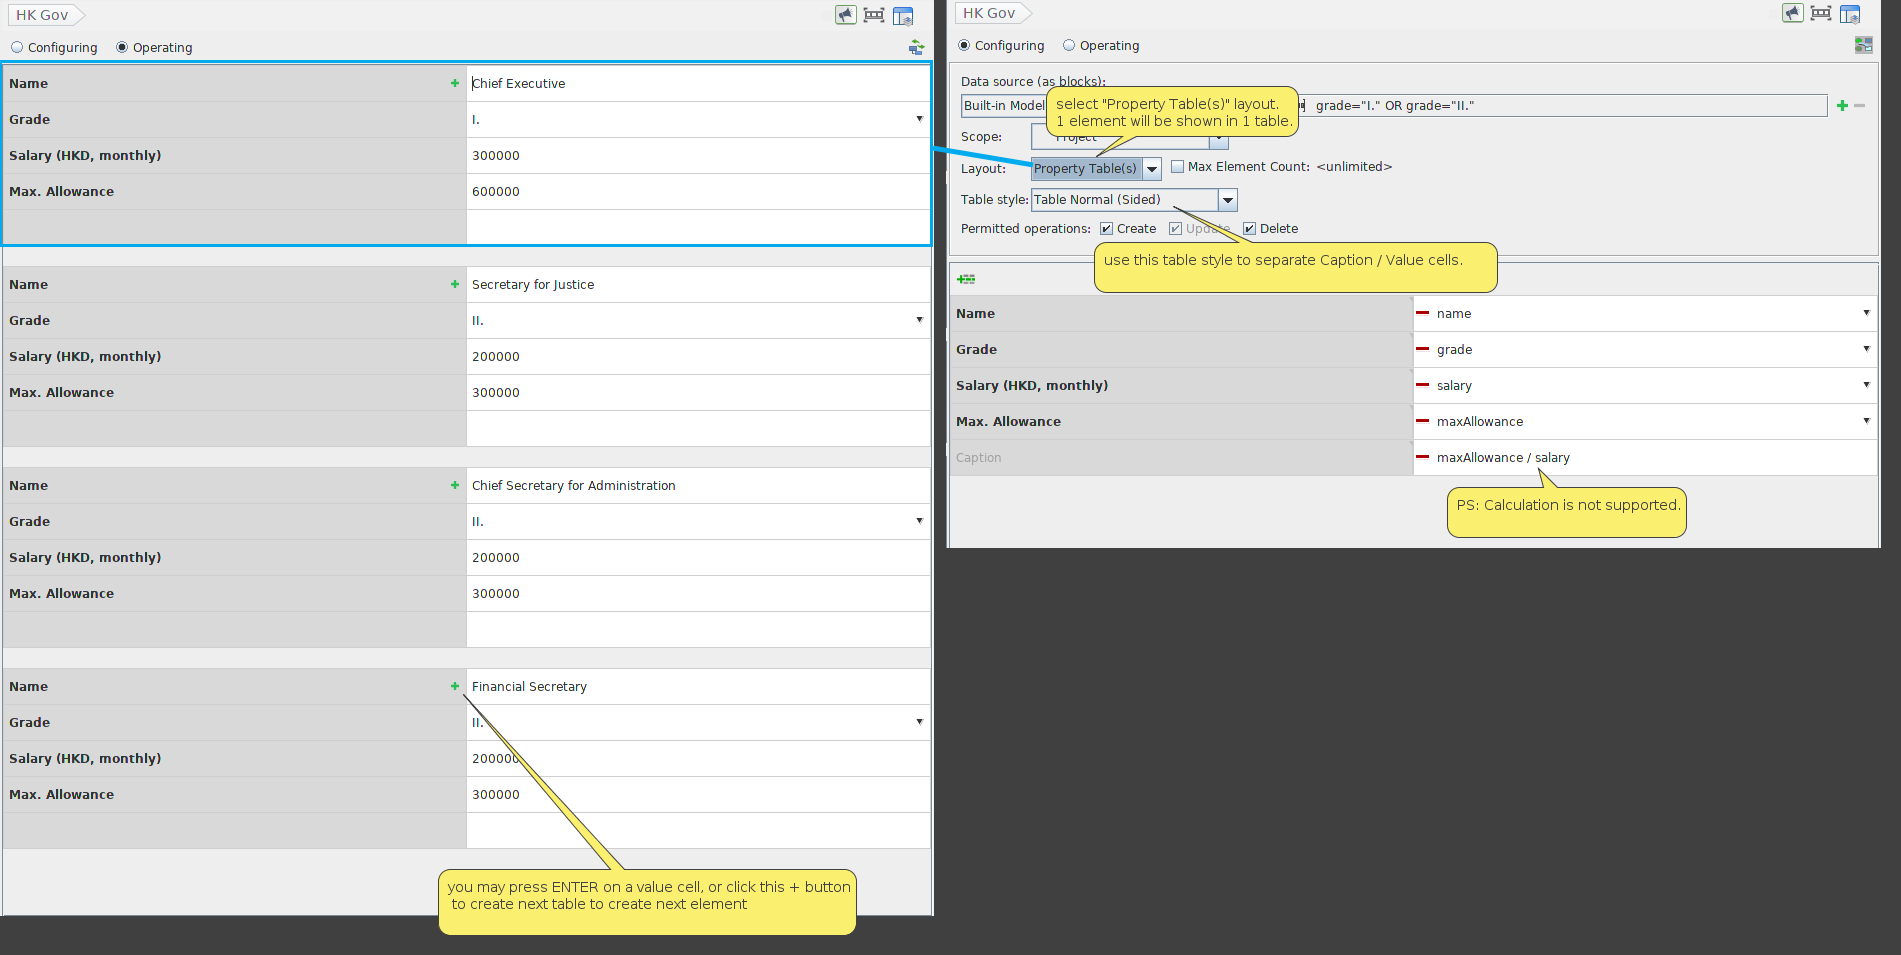
We can define a table to input their grade and salary
We can decide
- what kind of elements will be shown in this table.
- they are collected from which scope (e.g. from whole project? from a specified diagram? etc…)
- what properties (or tagged values) will be editable via this table.
- define the ‘data type’ of the tagged value. (e.g. Number Date, Enum etc…)
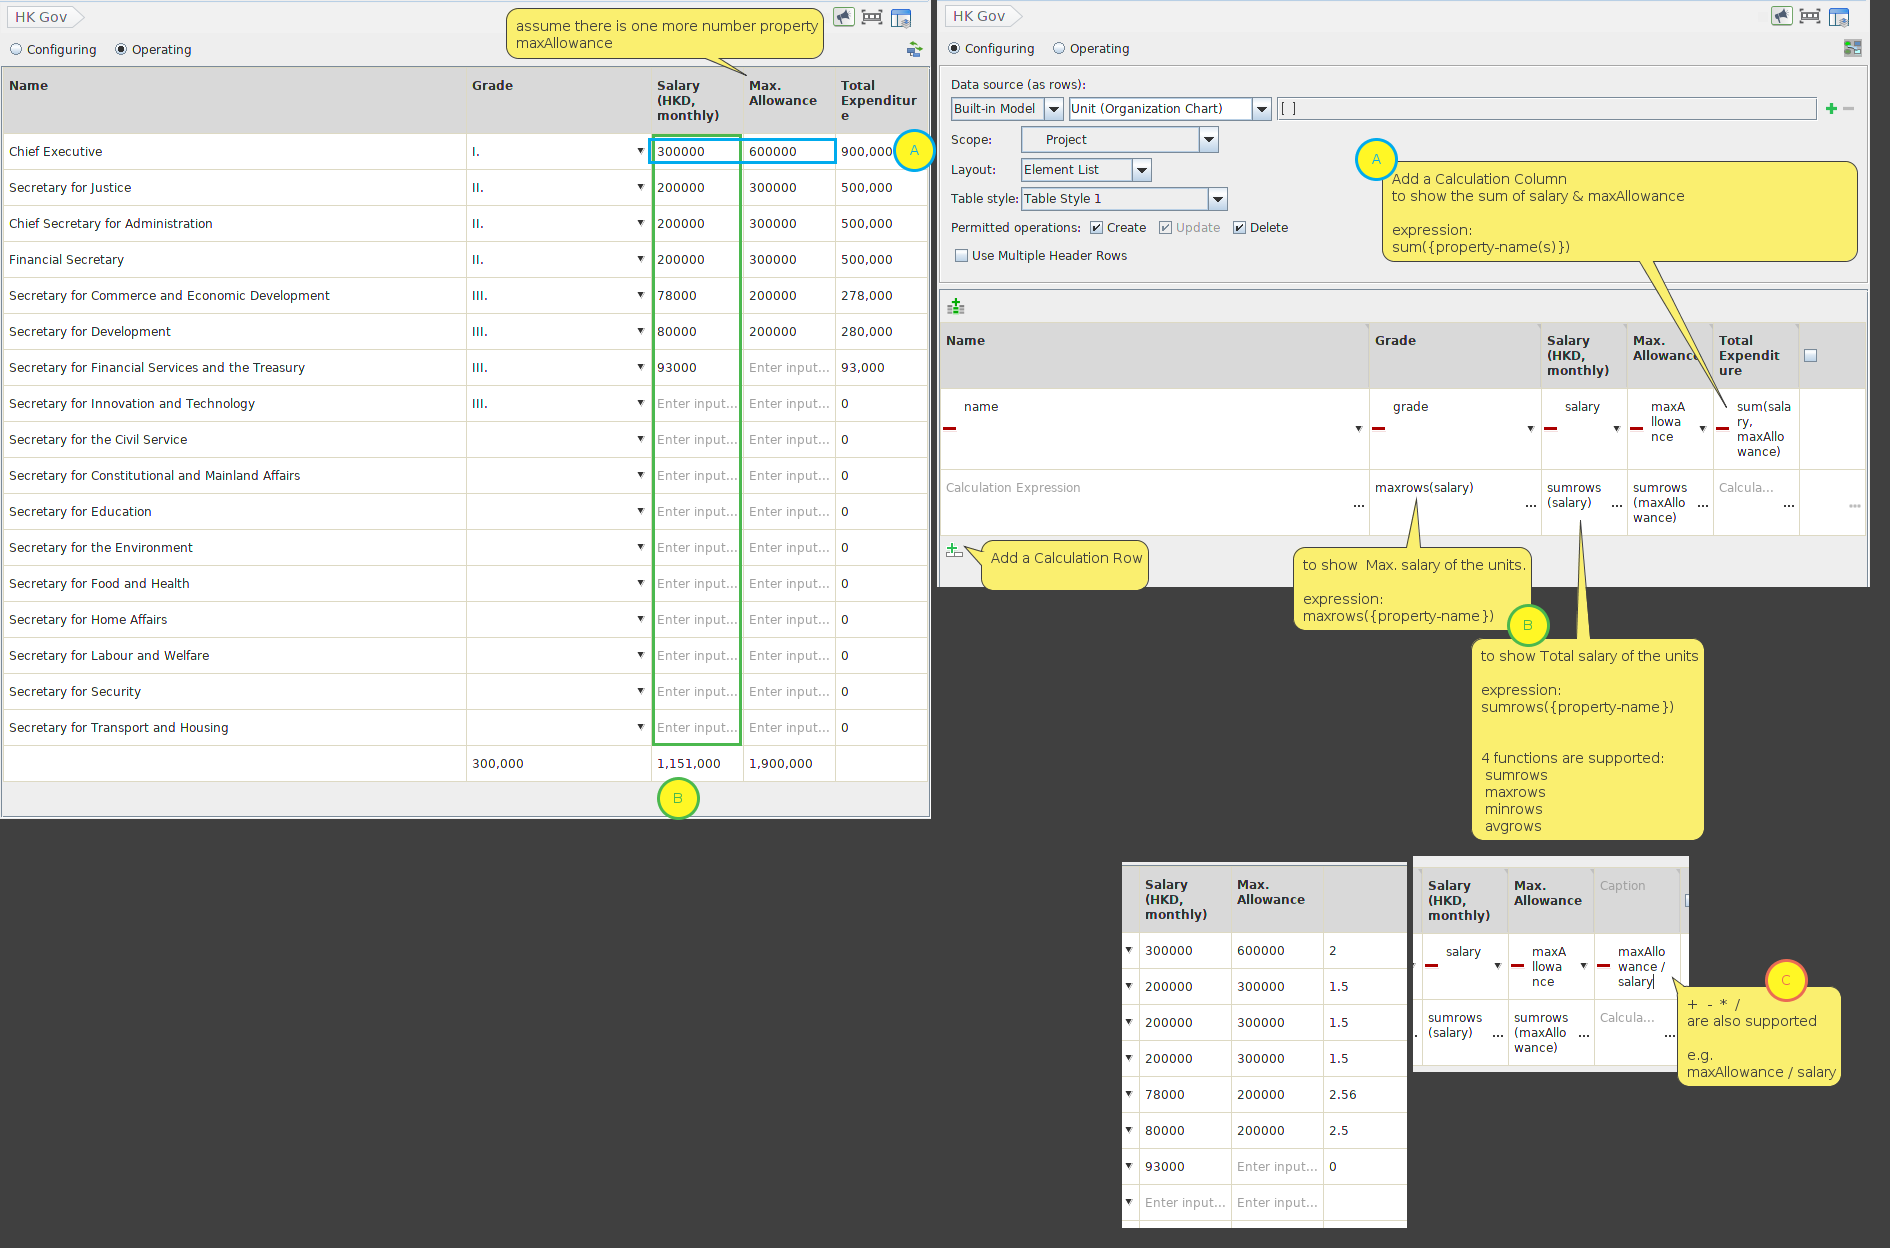
Calculation
We can add some Calculation Column / Row, to calculate the inputted number values by out expression
- on Calculation Column,
using sum(…), max(…), min(…), avg(…) to calculate the value(s) in this row.
- on Calculation Row,
using sumrows(…), maxrows(…), minrows(…), avgrow(…) to calculate the value in whole table.
- + - * / are also supported.
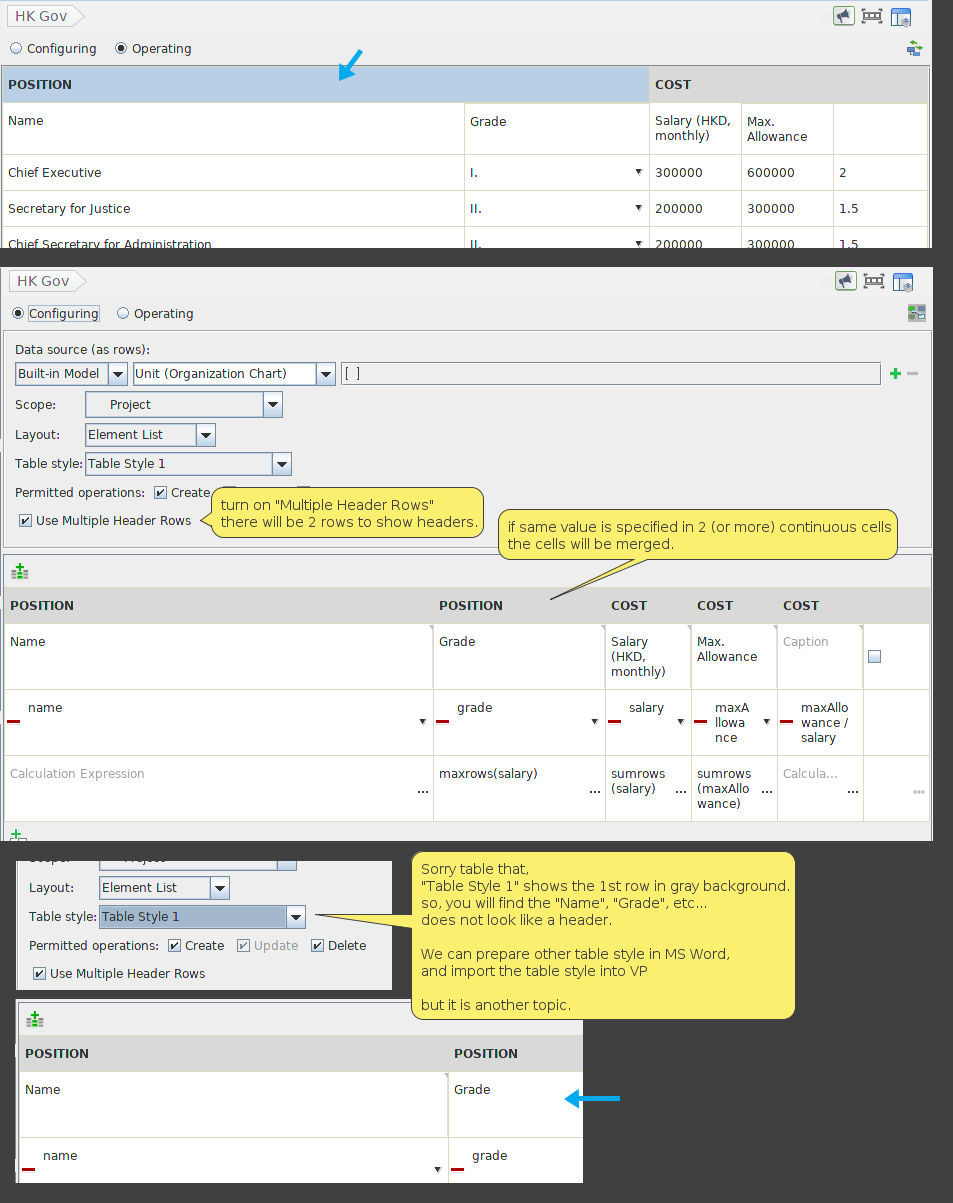
2 Header Rows
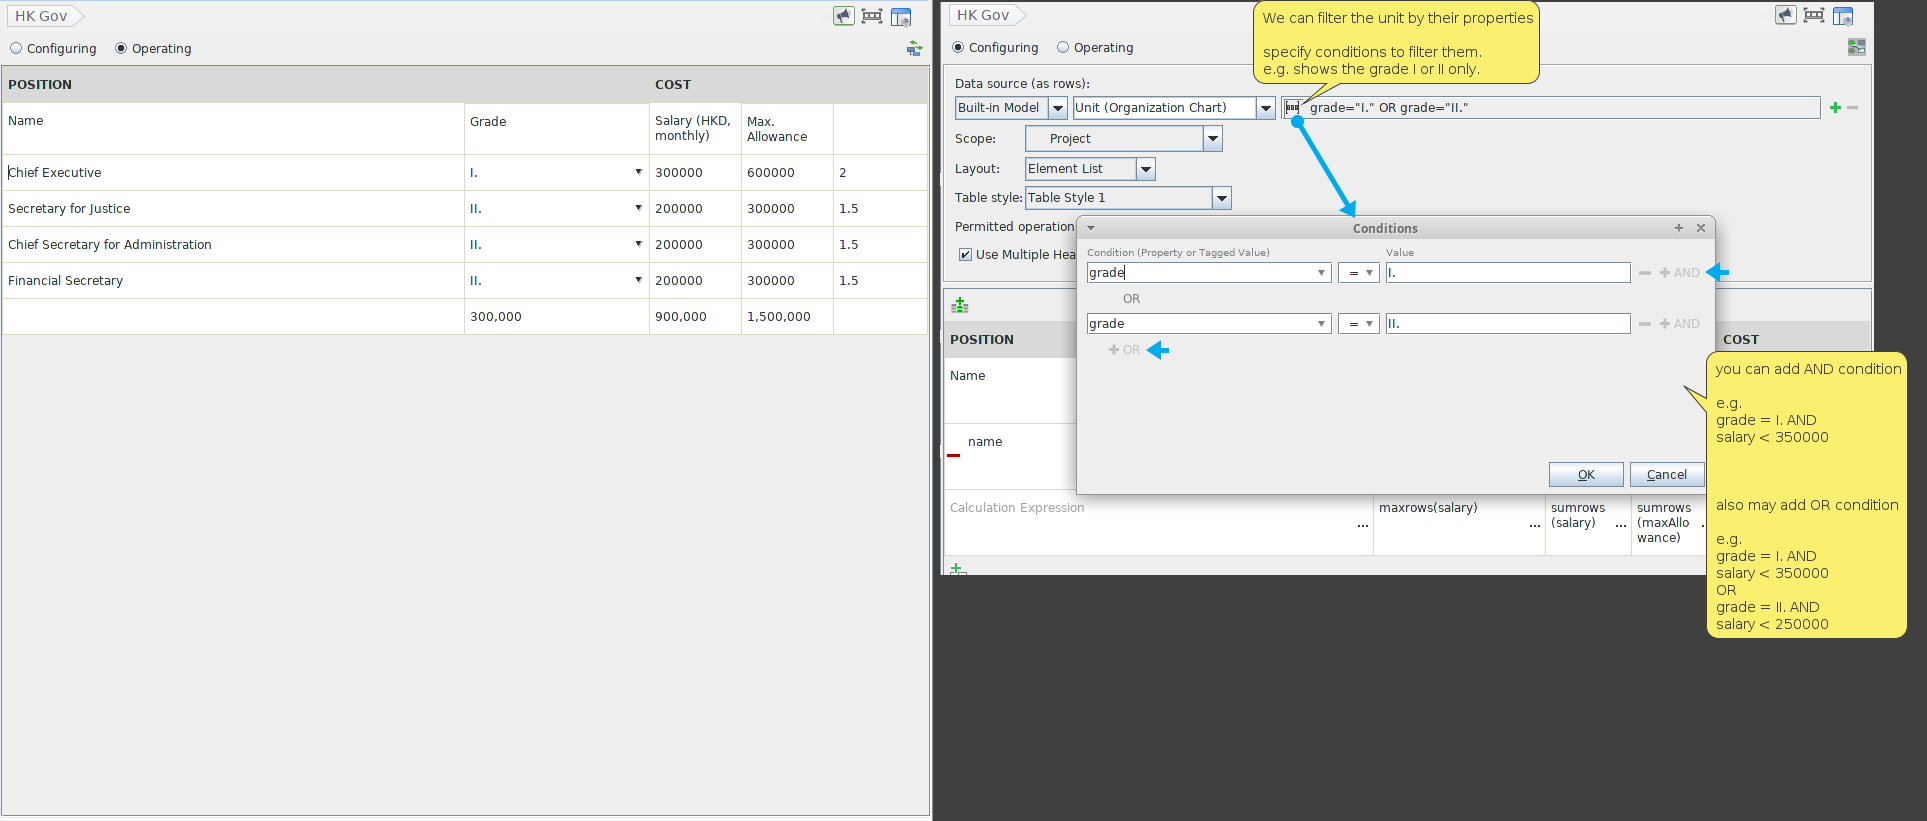
Filtering
Layout
Element(s) as Column(s)
Sorry, it is only working for Generic Model.
* Generic Model is a model type that defined by you (not belongs to any standards, e.g. UML, BPMN, ArchiMate etc…)