I don’t understand how to use the gauge chart.
how to configure? how to make the arrow appear? I didn’t find any of that in the component settings
Thanks for using Visual Paradigm.
Our gauge chart does not support on configure the arrow to appear.
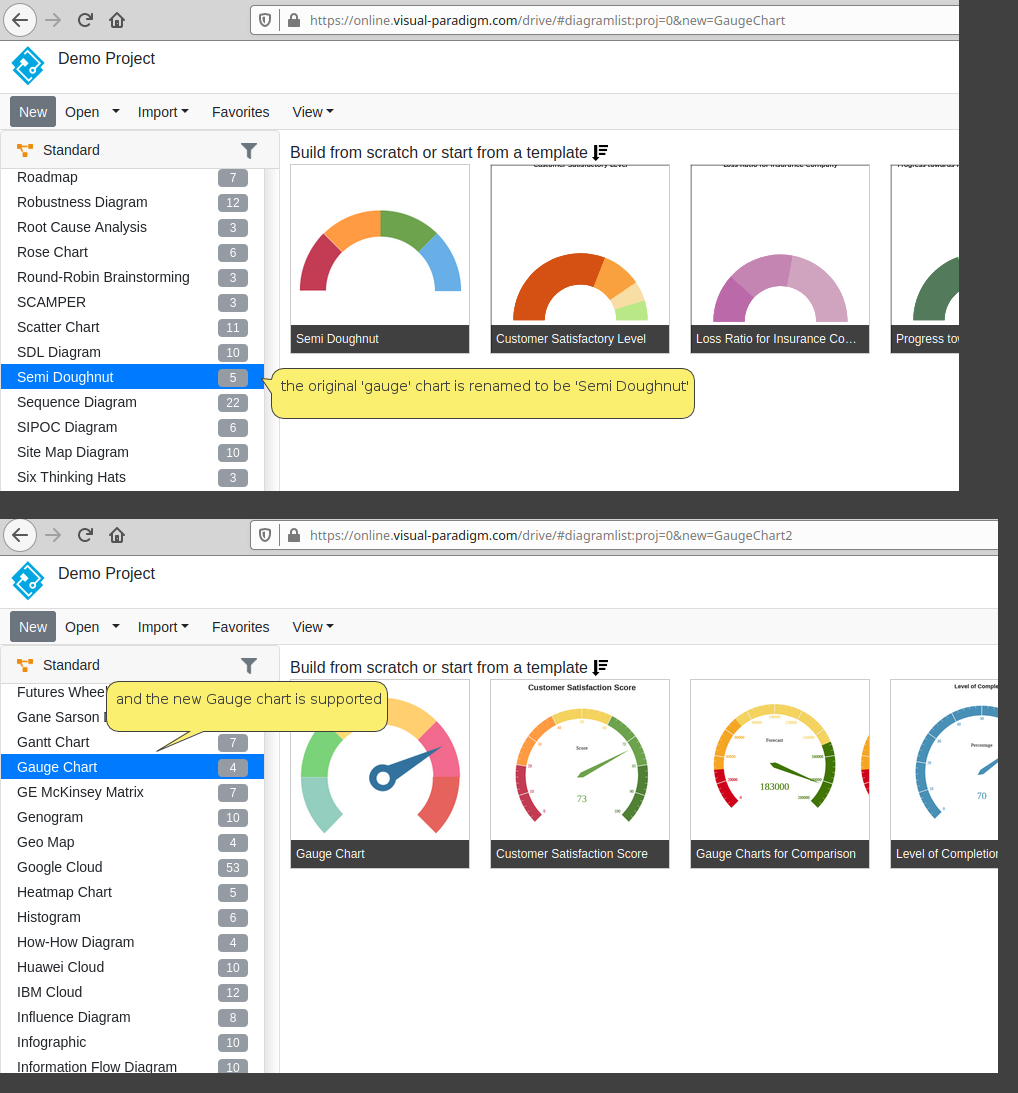
We should be better to name it as “semi circle pie chart”.
And we plan to support gauge chart (with arrow) in coming release.
Just to provide an update on this topic ![]()
The support of the gauge chart (the one with pointer) will be available within 1 to 2 weeks.