[multi-part demo] Project Management with Visual Paradigm

Disclaimer: If you want to try the things I’m about to demonstrate on your own then please be aware that several features are only available with the Professional edition and up. Both the Professional edition as well as the Modeler edition are two of my personal favorites and sometimes I like to share some of the awesome things you can do with them. Here it’s time for a “professional approach” :wink: , but you can definitely expect a “modeling session” to happen somewhere in the future.

Editorial

In my opinion the Visual Paradigm software is best known for its outstanding support for modeling standards. And why wouldn’t it be? I honestly believe that making diagrams has never been easier: you don’t need to drag items from a palette (also known as the diagram toolbar); just double click somewhere on the canvas to open the resource catalog, select a relevant model element and you’re well on your way. Need to connect one element with another one? Select the first, find the resource catalog icon in the upper right corner, drag and drop and select the connection you need to make (optionally with the new model element which you need to place).

But there is so much more which Visual Paradigm can do… Sometimes it even can perform tasks which might not seem obvious at first. So here’s an example at one of those things: Project Management. But… in a different way than you might think :slight_smile:

Project management, but what is that exactly?

At the risk of sounding a bit simplistic, but: project management (in a nutshell) is basically all about making sure that a project is feasible to undertake and that it will be successfully finished. Awesome, so what exactly is a project? In its basic form (yet still in a nutshell!) it is an undertaking, usually done by several people, with the intent to reach a certain goal.

Projects obviously come in all shapes and sizes. My current project, the writing of this forum post, is a rather small one and undertaken by one individual (me) yet also relying on a certain infrastructure (this forum). It really wouldn’t need much management.

But once you start working on larger projects where multiple people get involved and several individual targets need to be reached… then it becomes a whole different story. You need to stay informed about progress, you need to anticipate for setbacks, you need to keep set deadlines in mind and make sure you avoid those.

Basically: you need to stay in control over what is happening.

So how does Visual Paradigm fit into all this?

Simple really: Visual Paradigm, however: the Enterprise edition, provides a very impressive “Guide-through” feature which also addresses the project management lifecycle. A feature which I shall be addressing in more detail at a later time (and maybe on another platform).

But we’re not going to be using the Enterprise edition here :wink: (note: although I do have an Enterprise license I’m making fully sure that I won’t be using any “Enterprise only” features).

So, not a problem: Visual Paradigm online, usable through Visual Paradigm desktop, provides us with Agile as well as specific collaboration features such as Tasifier. Even the Modeler edition can use those.

Well… we are going to be using some of those features as well but not just right now.

See, the reason for my post in the first place is to demonstrate some of the cool things which Visual Paradigm can do for us when it comes to project management. But I never said that it would be holding our hand, we will actually need to actively use the tools at our disposal as best as we can. And all on our own accord. I also never said this was going to be easy :wink: But it will be very efficient, trust me on this one for now.

Identifying our goals.

Every project needs a goal, and my demonstration project will be no different. We will be managing the project of writing this thread about project management. I know it might sound silly, but that’s also what can make this both fun for me and easier to understand for you guys.

So… I made a new Visual Paradigm project and, as I always do, I am relying on Visual Paradigm online to keep my work safe.

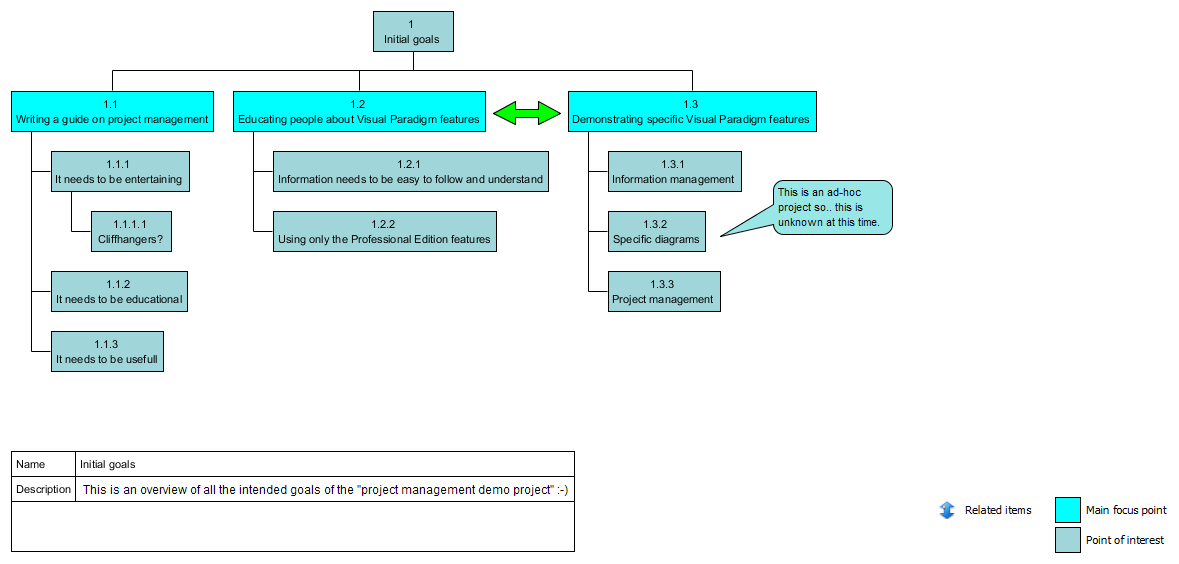
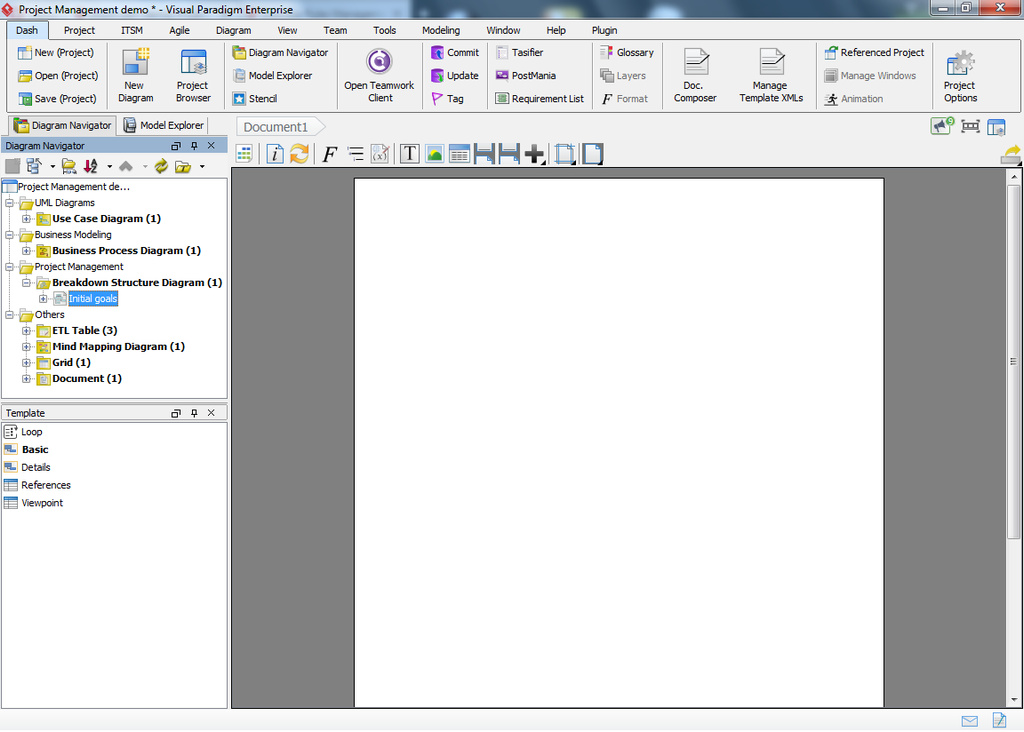
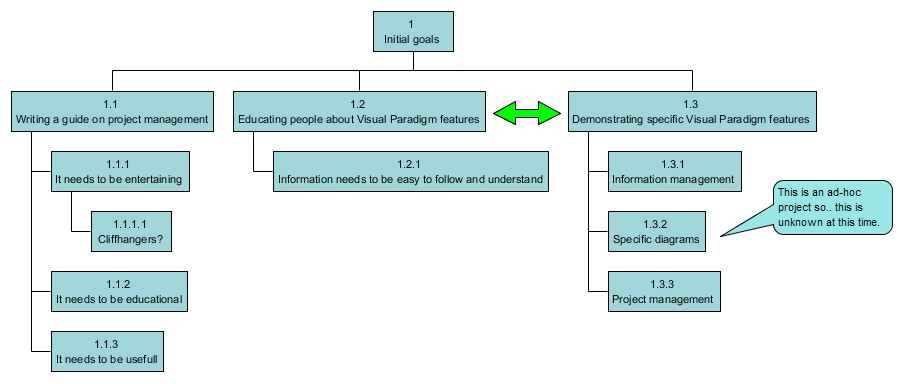
We are going to be doing some analysis so I created an Analysis model and added a breakdown structure diagram, called initial goals:

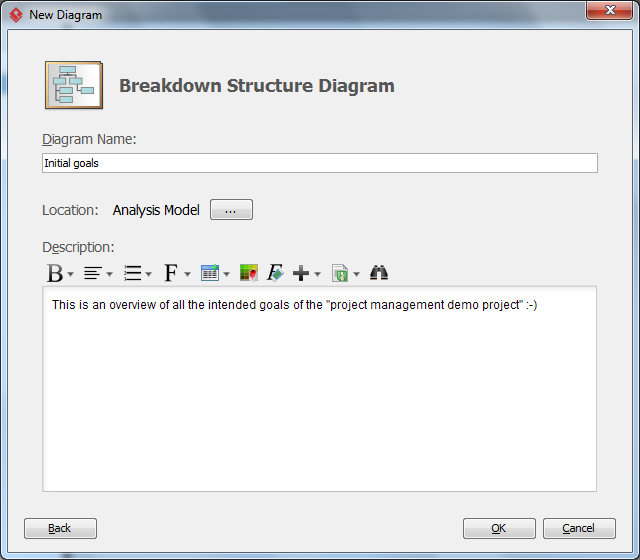
I know, I know… I can already hear at least one of you virtually screaming: “What about planning and schedules? What about our resources? What about deadlines?”.

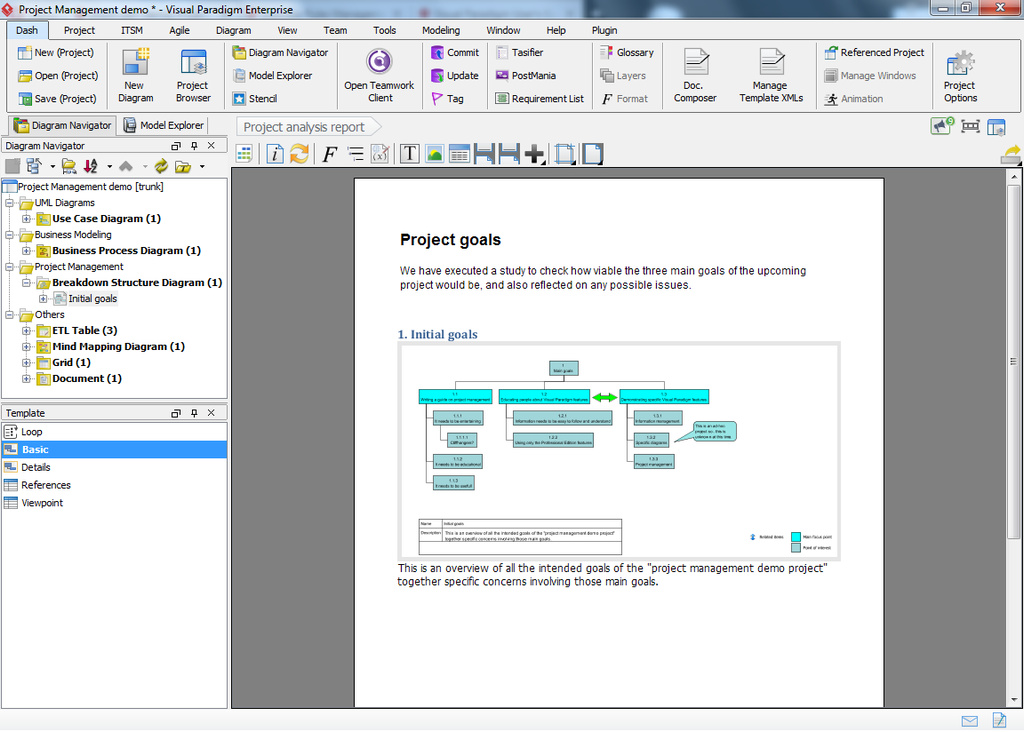
One step at a time. Haste makes waste, we’re going to focus on the main goals for now. So here is my breakdown diagram so far:

This project may be intended to be a bit silly and/or comical (“entertaining”) I will still be doing my best to make this look legitimate :wink: From my point of view this thread honestly needs to be both entertaining and educational, as such that’s included.
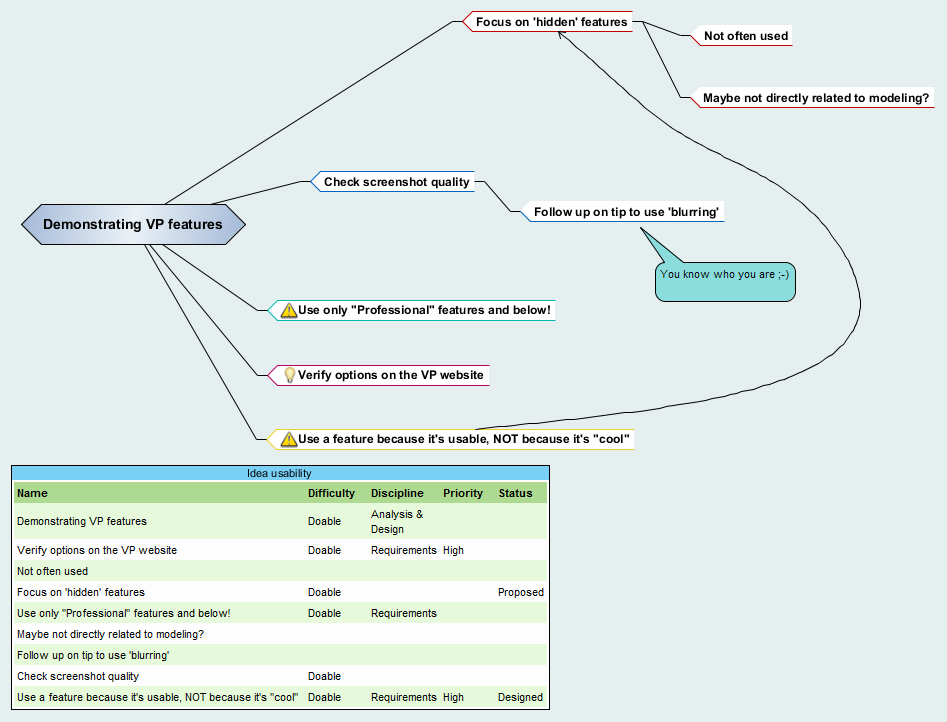
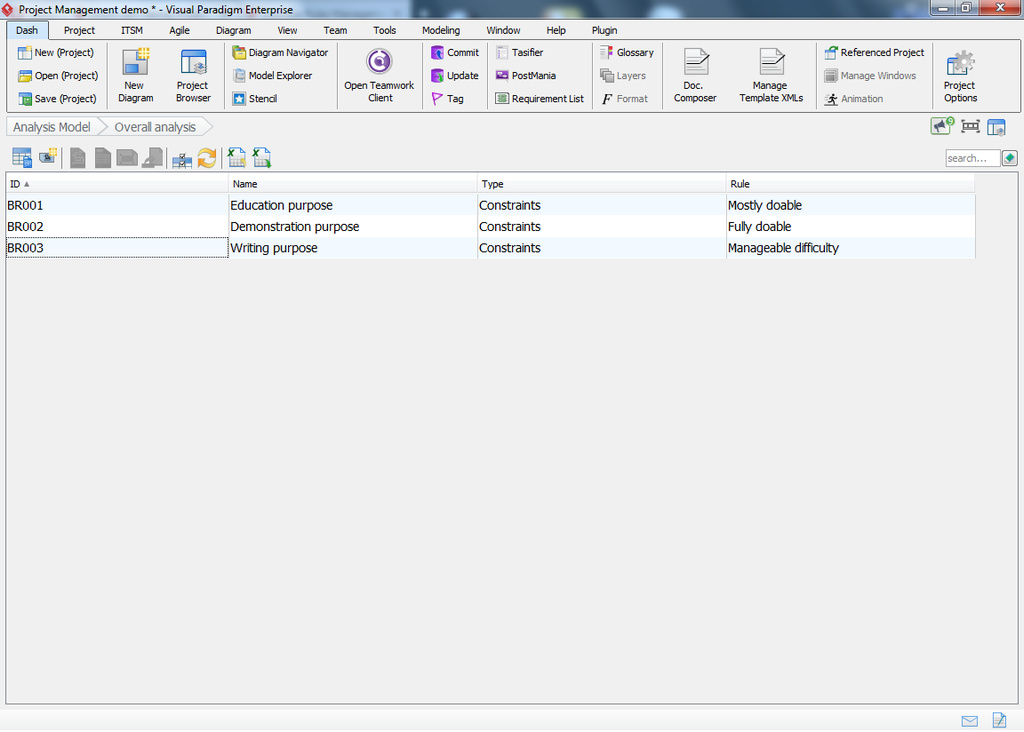
Investigating goals

So, my main goals should be obvious at this point:

  • Writing a guide on project management.
  • Educating people about Visual Paradigm features.
  • Demonstrating specific Visual Paradigm features.

I already broke some of this down into smaller parts (like 1.1.1; I didn’t even have to do anything myself to get this identifier) but I still need a bit more. Even so: 1.2 and 1.3 are closely related to each other and I want to visualize on that. I’m also not happy with the shout out box because every time I move 1.3 and its underlying elements then the shout-out box gets in the way.

Lets fix this…

image

Personal todo: look into options to use inline images on Discord Discourse (forum software) :stuck_out_tongue:

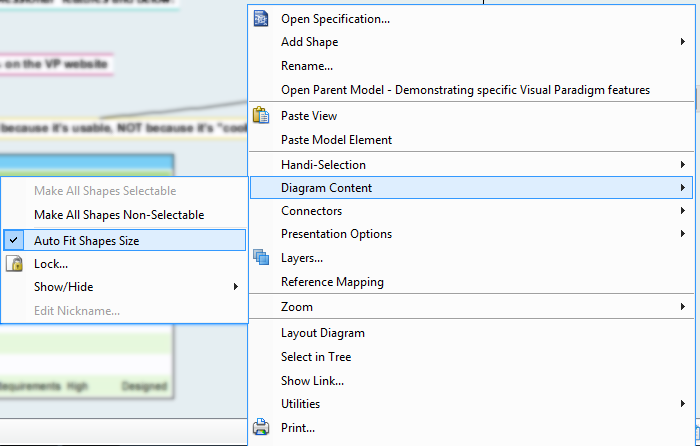
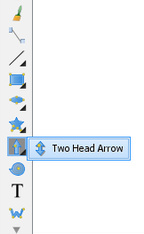
SO: I start by adding a 2 head arrow which you will need to drag out of the palette if you want to use it (hover your mouse over the toolbar / palette, then scroll down with the mousewheel).

Next I need to group 1.3 together with the shoutout. Here’s how:

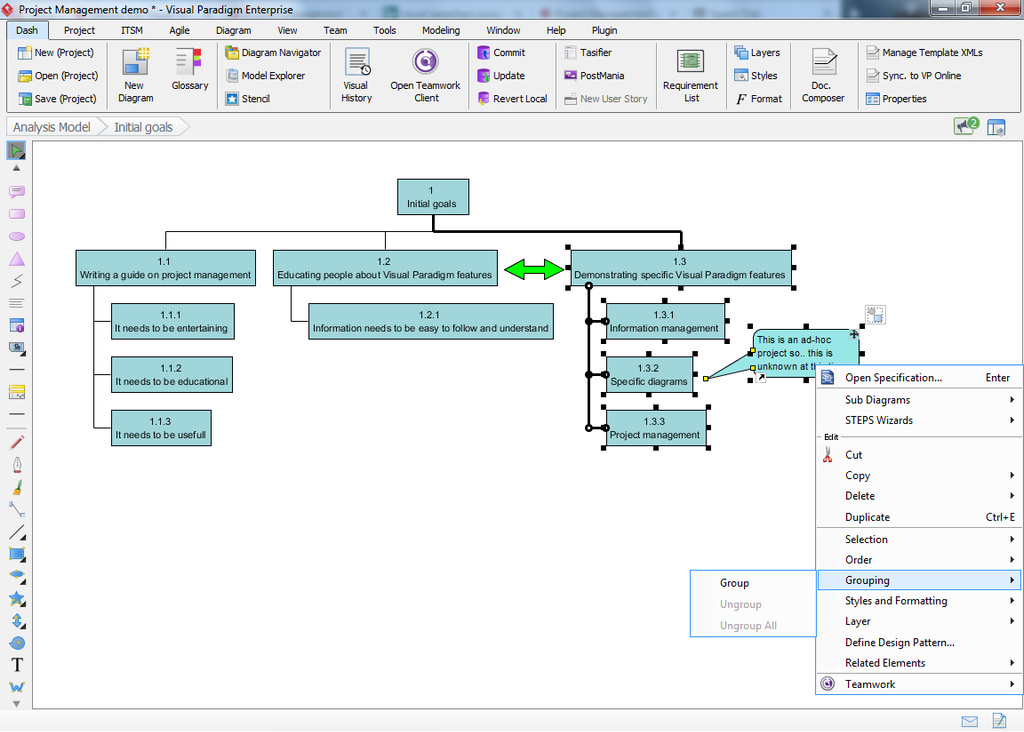
Select all relevant elements, right click, and then select the Grouping section. I know that this is all cosmetic stuff, but that too can be important.

But back to investigating…

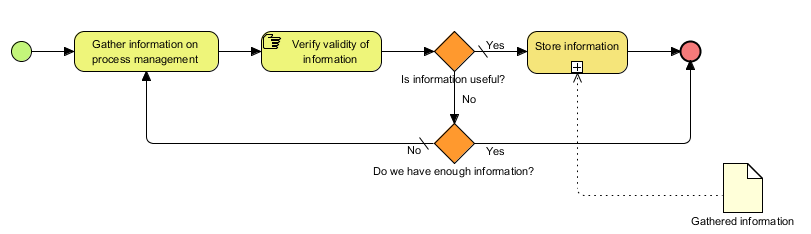
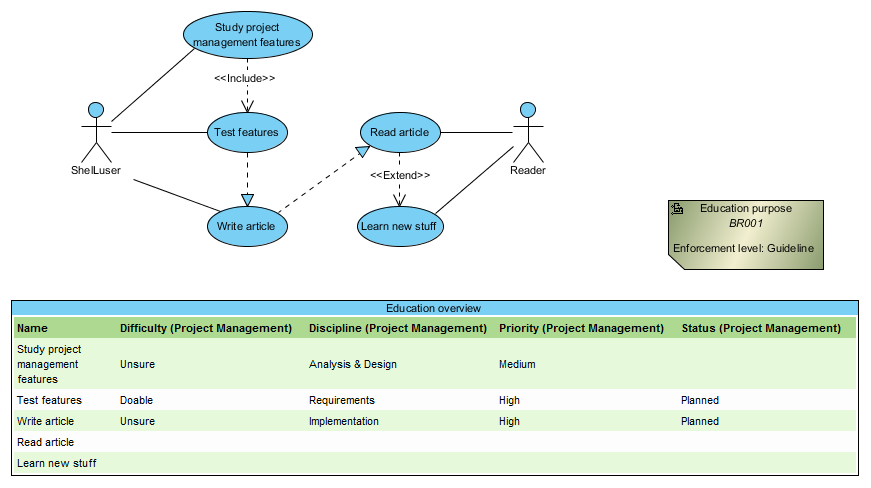
How does one write a guide on project management? It’s most likely a process one has to follow of some sort, so… I decide to add a sub-diagram which can help me identify the process in further detail:

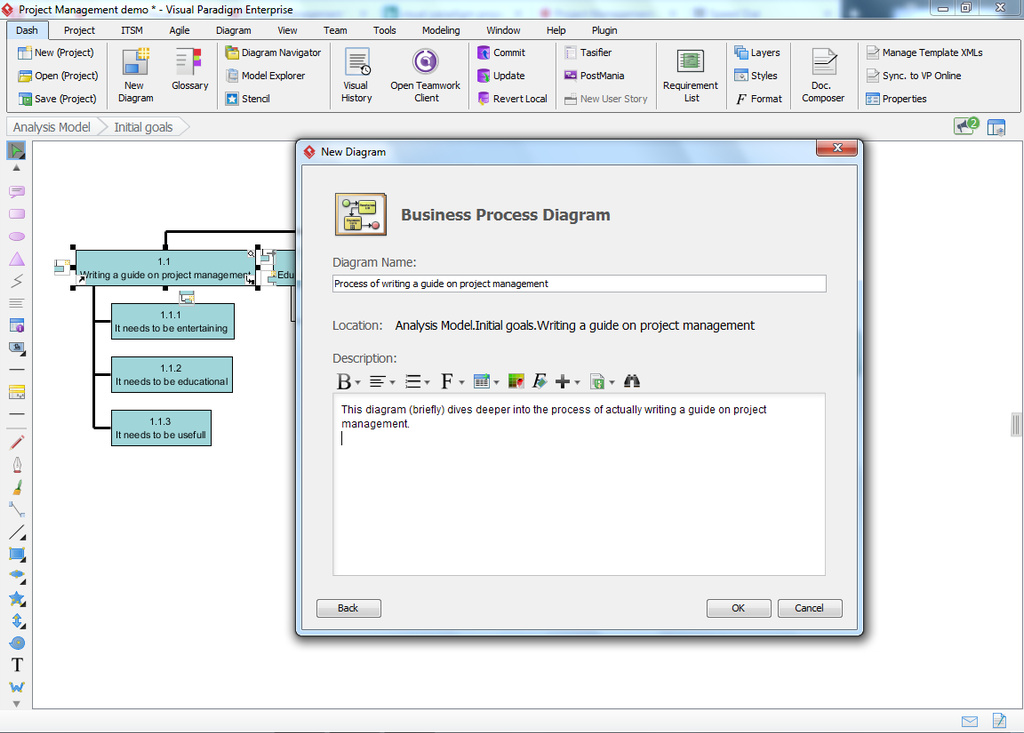
We’re going to be adding a business process diagram which will become a sub-diagram of the 1.1 model element. What this diagram will contain?

Well, it’s getting late here (no joking) so I am going to postpone this for my next post, which (if nothing goes wrong) you can expect to appear tomorrow.

Summary of this post

We made a break down diagram which showcases the main goals for our demonstration project. Next to the goals it also contains some additional (“break down”) aspects of several of the steps. And I just thought of something new:

Next post:

Diving deeper into 1.1 to provide us with more, hopefully useful, details.

2 Likes

And here is Part II of the first part of my multi-part thread :wink: Sorry for the delay, sometimes things get in the way of my planning.

In the previous part we’ve started our project management project, we’ve set up a ‘break down structure’ diagram to list all the main goals of our project:

  • 1.1 Writing a guide on project management.
  • 1.2 Educating people about Visual Paradigm features.
  • 1.3 Demonstrating specific Visual Paradigm features.

Yes: the goals are a little ‘cheesy’ but hopefully that also helps to keep this guide a bit lightweight.

So the next step I took was to create a BPMN diagram to investigate how doable item 1.1 would be, and this is the result:

Now, the reason why I used a BPMN diagram is because I favor the standard: it provides a certain flexibility which allows you to make the diagram as in-depth or abstract as possible. Something I somewhat demonstrated with the sub-process “Store information”; because this is only an analysis it doesn’t really matter how this is done.

But by using a sub-process like this it also provides me with a solid starting point to expand on the concept later provided that the project actually gets considered to be doable and will be officially started.

Which brings me to the next step:

Assessing the steps to reach our goal

Ayups: Visual Paradigm actually has a ‘Project Management’ tab available in the specification window of a model element (as shown above). If this doesn’t show for your edition right away try clicking on the black downwards arrow in the upper right corner and then select it to add the tab.

And there’s more: if you try to follow my steps one on one you’ll end up disappointed because you won’t find the “Doable”, “Unsure” and “Bad idea” difficulty ratings in your project. But that’s really easy to fix:

image

All configuration items neatly combined under one easy to find menu option, how easy can it be? :smile: Select this option and you’ll be able to add, remove and completely change all the pre-determined project management values to totally match your own specific needs.

This is one of the reasons why I started this thread. Because these features are so easy to overlook (in my opinion anyway) yet also so immensely powerful once you learn how to use these… you might end up hooked for life :wink:

But back to our diagram. It’s nice that we can now determine on a per-task basis if the task at hand is doable or not, but… I suppose we’ll have to guess their values while looking at the diagram?

Fortunately Visual Paradigm foresaw this problem as well and gave us the On-Demand Model ETL:

See also:

Now we get to see in the blink of an eye which tasks are doable and which are not. It couldn’t be easier, wouldn’t you agree? As you can see the on-demand ETL is also perfectly usable with BPMN and not just Use Case diagrams (which seems to be used in most examples, or so I think).

So we have one doable task and one medium rated task however that task was also tested so we don’t have to expect any weird surprises I suppose. As such we’ll just mark the 1.1 element in our breakdown diagram also as “doable”.

Please keep in mind that just because I used a BPMN diagram it doesn’t mean that you should do this as well. I’m going to take it easy and mark “1.2” to be ‘doable’ just like that and then we’ll dive into 1.3: “Demonstrating Visual Paradigm features”.

…using one of my favorite diagrams, Mind Mapping:

This is a classic example of what I’d describe as the “Visual Paradigm workflow”. Because all I did here is exactly the same as I did with the BPMN diagram above; I added my ideas, I used the project management options to specify certain aspects of the nodes and then I added an ETL table to clearly display that otherwise hidden information. It doesn’t really matter what diagram you’re using.

One important detail though:

Some diagrams, such as the Mind Mapping diagram, use “auto-shaping”, this means that any model element you place will have a specific automatically assigned size. Sometimes this might not be what you want, and if that’s the case then here’s the menu option you’ll need to stop that effect (I used this on the ETL table to make it a bit wider).

And that concludes this part…

Summary of this post

We made several sub-diagrams for our main goals in the break-down diagram to examine if these goals were actually doable. To document our findings we used the “Project Management” tab in the model element specifications to add specific values for ‘difficulty’, ‘priority’, ‘status’ and ‘discipline’.

We then added an ETL diagram table to showcase this extra information.

Next post:

Now that we have set our goals and examined them it’s time to finish our project analysis and determine if this project is doable or not. To do this we’re going to set up a decision table in our goal overview which should help us decide on whether our project is feasible or not.

But there’s more… We’re also going to be creating a document (template) which we can then use to inform both upper management (?) and/or other project team members about the results of our projects analysis. This should also help us to make our case for this project.

And if time permits (read: if my upcoming post doesn’t become too long) then we’re also going to start preparing for our actual project.

As always: thanks for reading, don’t hesitate to comment, and expect the next post somewhere within the upcoming week.

It’s about time I picked up on this mini-project, especially because even after all this time I still think it is an interesting subject. There is so much you can do with Visual Paradigm, especially within the field of project management and data analysis…

And although I dislike the hiatus it will also demonstrate a very important aspect: if you make sure that you properly document the entire process then it won’t matter too much if things don’t progress very quickly. Because you will always be able to pick up where you left off.

Where were we?

In the previous parts we set up a VP project to manage the project of writing this multi-part guide. I know it sounds a little silly but that’s intended because this wil keep the whole thing somewhat lightweight and easy to follow.

We started with the analysis phase and made a breakdown structure diagram to plan out the required steps of the project and any specific points for attention. It all boils down to three main aspects where the last two are somewhat related:

  • 1.1 Writing a guide on project management.
  • 1.2 Educating people about Visual Paradigm.
  • 1.3 Demonstrating specific Visual Paradigm features.

Basically this:

Project analysis

In the previous post I mentioned that I was planning on using a decision table in order to provide an overview to help us decide on the project status. Unfortunately that turned out to be a bad idea. Decision tables definitely have their place, but it’s not here :wink: Instead we’re going to do something else. First I’ll continue where I left off and create yet another sub-diagram for the last item I haven’t ‘studied’ in-depth yet: 1.2: Educating people about Visual Paradigm features. I’m going to set up a Use Case diagram which should showcase some of the specific items for both myself and the viewer(s). As before I’ll be adding meta-data to the use cases and will display that through the use of an ETL table.

But we’re also going to add something else: a new business rule model element in all diagrams (including the previous BPMN & Mindmap) to indicate the overall validity of the item. Something like this:

Once we have rules in place for all initial goals then we can make a business rule overview (grid) to give us an overview:

You will probably notice that I didn’t use the business rules as intended; instead of using them to define strict rules which the system needs to follow I made it more into an analysis tool. This is an important issue with modeling and information management in my opinion, because ask yourself this: what is more important? Closely following standards and pre-determined rules, or using your tools in such a way that you’ll get a good end result with minimum effort?

There really isn’t a “good” or “bad” way here, as long as the end result is met. Which, in this case, boils down to showcasing the conclusion to our analysis in an easy to understand way. Which brings us to…

Making an analysis report

Now we reached the end of our project analysis. We defined all the initial goals of our project and elaborated on them with specific points of interest (in the break down structure diagram). We then created a diagram for each of the three main goals in order to further analyze the required tasks, difficulties (or issues). Finally we added rules to our diagrams in order to get an overall impression.

So now that we have put a lot of information into Visual Paradigm how are we going to get it “out” again? I suppose I could print (or export) all the individual diagrams and then use a tool such as Word (or LibreOffice writer) to make a report which we can then send to upper management, but there is a risk involved.

What would happen if I were to discover something wrong in one of our diagrams which required changes to be applied? Then I’d have to apply my changes, export my diagram again and re-import it into Word (or Writer). That’s a lot of effort and basically a waste of time.

So we’re not going to do that, instead we’ll be using Visual Paradigm’s Doc Composer to collect all the individual parts which made up our analysis and combine them into one easily generated (and exported) report. We’ll have a PDF ready in no time.

Composing a report with Doc Composer

image

Doc Composer is amazing. As you can see in the sceenshot above we have 2 options which we can use. First is to build our report from scratch; we’ll literally be adding all the different bits and pieces from our project so that VP can then generate a report from it. As you can see you can export it as Word, PDF or even generate HTML code so that you can easily put your report online.

The second option, which we won’t be using, is also very impressive: instead of building everything from scratch you’d make a template using Word which Visual Paradigm will then process to fill in any specific components in specific pre-determined places. This can be very useful if you need your report to be build in a specifically formatted setup (think about templates which contain a company logo for example).

DIagrams & templates

Here you see the main working screen of the doc composer. In the upper left pane you get an overview of all your diagrams neatly separated by diagram type. And don’t worry: if you need a better overview then you can always use the model explorer or switch the diagram navigator to diagram hierarchy mode. This can be important with larger VP projects where you’d have different diagrams divided across different models. For example: right now I’m working inside an analysis model, but once we finished our report we’ll add an implementation model or maybe a planning model. But I’ll explain more about that in an upcoming post.

In the pane on the bottom left we see the mentioning of templates. A template is an XML formatted code which defines how our report section should look. In the screenshot above you’ll notice mentioning of Basic, Details, References and Viewpoint. All those names represent different XML code snippets which will show a different part and apply a different formatting for our selected diagram.

For example, here is the XML template for a basic diagram (just to give you an impression, you don’t have to study it :wink: ):

<?xml version="1.0" encoding="UTF-8"?>
<AnyBaseInitiationBlock>
	<!-- generate IMAGE of the diagram only, no need generate the Name/Id/Description etc... -->
	
	<!-- special handling for DataTable/Matrix/Chart/etc... -->
	<ValueChecker property="type" value="DataTableDiagram">
		<DataTable/>
	</ValueChecker>
	<ValueChecker property="type" value="MatrixDiagram">
		<MatrixDiagram/>
	</ValueChecker>
	<ValueChecker property="type" value="ChartDiagram">
	</ValueChecker>
	<ValueChecker property="type" value="GridDiagram">
		<GridDiagram tableStyle="Summaries"/>
	</ValueChecker>
	<ValueChecker property="type" value="ETLTableDiagram">
		<ETLTable tableStyle="ETLTable"/>
	</ValueChecker>
	<ValueChecker property="type" value="TextualAnalysis">
		<HasValueChecker property="textualAnalysisDocument">
		<Property property="textualAnalysisDocument" style="Description"/>
		<ParagraphBreak/>
	</HasValueChecker>
	</ValueChecker>
	<ValueChecker property="type" value="DTBDecisionTableEditorDiagram">
		<DecisionTableDiagram/>
	</ValueChecker>
	
	<!-- Else, for general diagram. Generate IMAGE -->
	<ConditionsChecker flag="false">
		<Conditions type="or">
			<ValueChecker property="type" value="DataTableDiagram"/>
			<ValueChecker property="type" value="MatrixDiagram"/>
			<ValueChecker property="type" value="ChartDiagram"/>
			<ValueChecker property="type" value="GridDiagram"/>
			<ValueChecker property="type" value="ETLTableDiagram"/>
			<ValueChecker property="type" value="TextualAnalysis"/>
			<ValueChecker property="type" value="DTBDecisionTableEditorDiagram"/>
		</Conditions> 
		
		<Image alignment="center"/>
		<ParagraphBreak/>
	</ConditionsChecker>
</AnyBaseInitiationBlock>

This template checks for the type of diagram we’re using and depending on that adds an outlined image. And the best part is that we can make our own templates if we want to. You’d need to make yourself familiar with the syntax of course but fortunately Doc Composer is very well documented, see the online VP documentation for more information on that.

Drag and drop

Now, we’re not going to bother ourselves with custom templates. Instead we’re going to use default templates to add specific elements to our report. First I went over the document properties to add any relevant information (title, description, proper name, etc.) and then started by adding a text box in which I wrote a brief introduction. Then I added the first diagram; our structure break down. And guess what? The first problem becomes immediately visible:

Notice the text at the bottom of the diagram? That’s simply the description I added to that diagram. However, as you can see it’s missing a word. Now what?

Well, this is exactly why we’re using Doc Composer. Instead of having to make new exports I can simply open the breakdown structure diagram (even from within the doc. composer), fix the description and then it’ll be automatically fixed in my report as well. All I have to do is click the ‘Refresh’ option afterwards and we’re done!

This is so much better than using external editors. Think about it: what would happen if I had fixed that description in an external editor, but forgot to edit the actual diagram after I finished the report? A very likely result would be that I’d run into this problem again when if I had to make another report. But that does not have to happen if you’re using Visual Paradigm! :slight_smile: We’re not only making a report: we’re also proof reading and double checking our analysis at the same time.

Which was needed because when I added the other diagrams I ran into another problem… The ETL table and business rules are part of the diagrams. However, I don’t want to display those together with the diagram in my report. Instead I’ll show the ETL tables individually (together with some optional comments) and I want to end the analysis report with showing the business rule grid which also provides a motivation for my end conclusion.

Fortunately that problem is also easily fixed by creating an extra layer for each diagram, adding the ETL table and business rule to that layer after which I made the layer invisible. Now these elements won’t show up in our report anymore.

So basically all I’m doing here is adding a few text boxes to provide a report introduction (as well as some general comments) and then drag my diagrams onto the report. And because I made sure to describe everything (so: all my diagrams have a description) I don’t have to worry too much about any further explanations.

In case you’re interested then you can view my generated report here (link to the online PDF document).

Keep in mind that the report obviously looks a bit sparse, this is merely an example after all, and I didn’t put in too much effort. But I do think that it clearly demonstrates how easy it is to make such a report.

Summing up

We concluded the project analysis by making a report which included all our diagrams to highlight all the information we collected and which provided our overall conclusion. I committed the project to Visual Paradigm online and also gave it a tag.

Next time

In the next part (and this time I won’t make any predictions on when I’ll write it :wink: ) we’re going to create a new model so that we can keep a clear separation of our diagrams. The ones which got made so far are all used for the analysis, but now that we concluded that stage it’s time to focus on our actual planning. And models are an ideal way to keep our diagrams nicely divided.

Speaking of planning; we’re also going to make a PERT chart to help us with getting a good overview of our project and all the steps that are involved. Optionally we’ll also be using sub diagrams again if a certain step requires further explanation.

This is also one of the major advantages which I believe Visual Paradigm has over the competition: you can use it for every stage of your project. From analyzing, planning and of course managing the actual project once it has actually started. And before you wonder: despite the ‘Agile’ tab shown in the toolbar we’re not forced to use Agile at all (and we won’t :wink: ).

Thanks for reading, hope this was a useful for some of you.

1 Like